The Sales Report That Builds Itself Every Monday
Stop building reports in spreadsheets every week: an automated sales report gathers your data, assembles itself, and arrives on time. Here's how it works.
The Sales Report That Builds Itself Every Monday
There’s a ritual repeated in thousands of companies: it’s Monday morning and someone — sometimes an analyst, sometimes the manager personally — opens four different files, copies, pastes, cross-references, formats, and wrestles a pivot table to assemble “the report.” Two or three hours later, the document goes out by email. By Tuesday, it’s already stale.
Getting rid of hand-built spreadsheet reports isn’t a big-corporation luxury: it’s one of the most gratifying automations there is, because it attacks a weekly, visible pain suffered by exactly the people who make decisions. Let’s look at how an automated report works, what it needs to be trustworthy, and why it changes the management conversation.
Why does the manual report hurt so much?
Because it concentrates three problems in one document:
- It’s slow at the worst moment. Monday morning is when knowing how the week closed matters most — and it’s exactly when someone is trapped copying and pasting instead of analyzing.
- It’s fragile. Every manual step is a chance to err: the range that didn’t update, the branch that didn’t send its file, the formula someone overwrote. And a report caught with one error stays under suspicion forever.
- It depends on one person. If the person who builds it is on vacation or leaves the company, the report doesn’t go out — or goes out different. The knowledge of “how it’s assembled” lives in their head.
The clearest symptom: in the Monday meeting, people debate whether the numbers are right instead of what to do about them.
How does an automated report work?
The idea is simple: the tasks a person does today — pulling data, cross-referencing, calculating, formatting, sending — are done by a system, in order, without fatigue, at the exact same time:
- Connect to the sources. The system connects directly to where the data lives: your invoicing system, the point of sale, the database, even spreadsheets if part of the operation still runs there. No exporting, no asking anyone for files.
- Cross-reference and calculate. The rules your analyst applies today — how sales are grouped, what’s compared against what, how goal attainment is computed — are written once and executed identically every week.
- Validate. Before sending anything, the system checks the basics: did every branch’s data arrive? Do the totals match the source system? If something’s missing, it alerts the right person instead of shipping an incomplete report.
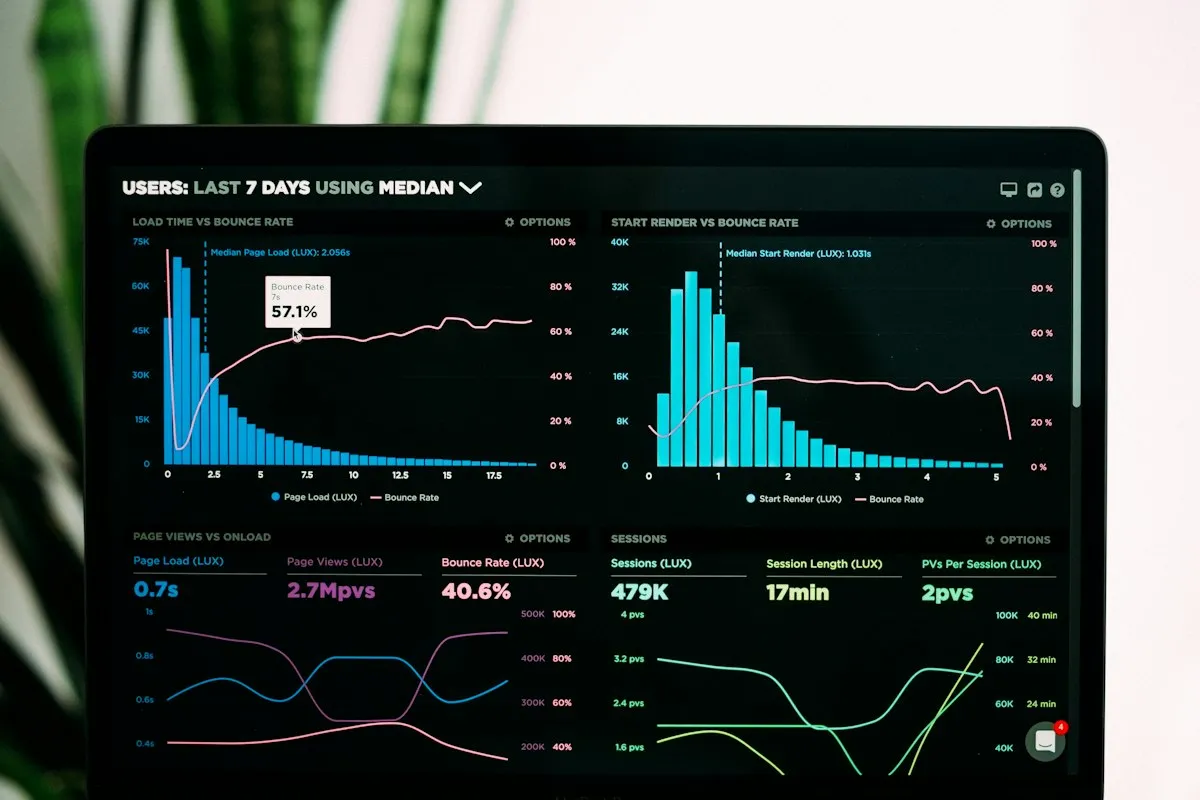
- Deliver on time. Monday at 7:00, the report arrives on its own: as a PDF by email, as a summary message, or better yet, as an always-current dashboard anyone can check at any moment — without waiting for Monday.
That last option is the real quality leap: moving from report-as-photograph to dashboard-as-window, where today’s numbers are always available. It’s exactly what we build in our data and reporting service.
What does it need to be trustworthy?
Report automation is only as good as its foundations. Three conditions rule:
- Accessible sources. The data must be readable automatically. Good news: almost every modern system allows it, and bridges exist for those that don’t. If your operation still lives in scattered spreadsheets, the first step might be a different one — we cover it in signs your business has outgrown spreadsheets.
- Agreed definitions. What counts as a “closed sale”? Order date or payment date? With or without tax? The manual report hides these ambiguities because someone decides on the fly; the automated one forces the team to agree once — and that conversation, however uncomfortable, is gold: afterward everyone speaks the same language.
- An owner of the data, not of the assembly. Someone on the team stops building the report and starts supervising that the sources stay healthy. Fewer hours, more value.
What actually changes?
More than a simple saving of hours:
- The Monday meeting changes subject. From “are these numbers right?” to “why did this line drop and what do we do?”. Same team — but now discussing decisions.
- Problems surface earlier. With a daily dashboard, a branch’s sales dip is caught on Tuesday, not at month-end close. The cost of reacting late is among the highest and least measured in a small business.
- Management asks more questions. When checking a number costs zero, people check more. A data-driven culture isn’t born from a speech: it’s born from the data being one click away.
- A valuable person is freed. Whoever built the report is almost always one of the most capable people in the area. Giving them back half a day a week has a direct return.
Where to start without overcomplicating?
Not with the giant forty-indicator dashboard. The proven path is picking the report that hurts most — usually the weekly sales report — and automating exactly that one, with the same figures as today, so the transition builds trust instead of debate. With the first one running, the next ones (collections, inventory, production) stack onto the same foundation.
If you want to know how automatable your current report is, the evaluation is quick: in a free call tell us where your numbers come from today, and we’ll tell you what can be connected, what can’t, and where to start. Worst case, you leave with your process clearer than before.